Prediction of Stock Price by using LSTM
시작하기에 앞서
-
이번 포스팅은
LSTM을 활용한 주가예측 프로젝트 입니다. -
작업 환경은
Colab notebook,PyTorch를 활용하며 코드는 아래 링크에 공유되어 있습니다.https://github.com/nanoteyep/ToyProject/blob/main/StockLSTM/StockLSTM.ipynb
왜 이런 프로젝트를?
이번 프로젝트를 진행하게 된 계기는 단순히 RNN을 배우면서 궁금했기 때문입니다. RNN은 Sequencial data, 즉 순서가 존재하는 데이터를 다루고 있습니다.
그렇기에 주로 자연어를 처리하기 위해 사용되곤 하였습니다.
하지만 시계열 데이터라고 하면 가장 대표적인 데이터는 바로 주가데이터 입니다. 그렇기에 저는 RNN기반 모델에 주가 데이터를 넣어 미래 주가를 예측해 보기로 하였습니다.
문제 정의
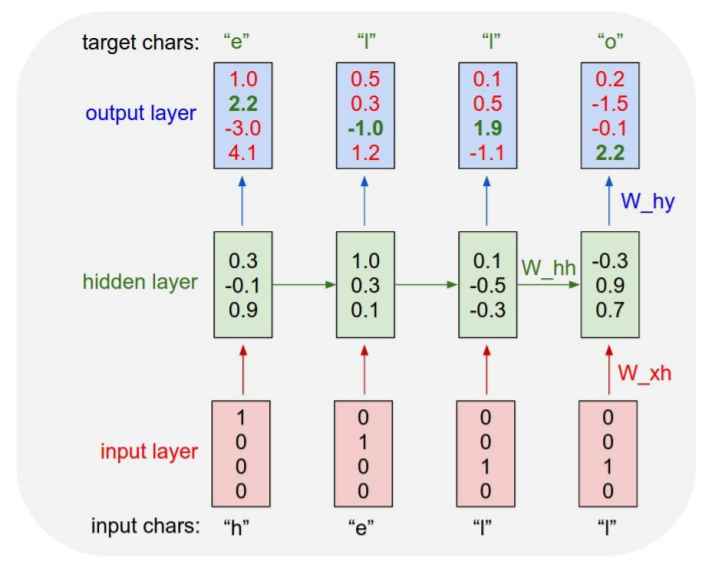
이번 프로젝트에서는 Character RNN의 구조를 사용하기로 하였습니다. 이 구조는 한 time-step의 출력이 다음 time-step의 입력이 되는 구조입니다.
즉, 특정 일자의 주가를 통하여 다음 일자의 주가를 예측하고 이를 이용해 또 다시 다음 일자의 주가를 예측하는 구조입니다.
이번에 사용될 모델은 LSTM입니다. LSTM을 사용하는 이유는 주가 데이터의 특성상 time-step이 무척 길어지기 때문입니다. LSTM은 RNN기반 모델이지만 time-step이 길어지면 그 정보를 소실하는 RNN과 다르게 긴 time-step에도 그 정보를 유지 합니다.
또한 이번 문제는 주가를 예측해야 함으로 회귀문제입니다. 그렇기 때문에 LSTM의 결과를 Fully Connected Layer에 연결하여 하나의 숫자, 즉 주가를 산출하는 방식을 사용 할 것 입니다.
데이터 정의
이번에 사용할 주가 데이터는 FinanceDataReader라는 Python의 모듈을 사용하여 구하려고 합니다.
또한 이번 주가 데이터는 종가 만 사용 할 예정이며 일일 주가 데이터를 월별 주가 데이터로 가공하여 사용하려고 합니다.
월별 추이가 일별 추이보다는 확실한 움직임을 잘 관찰할 수 있을 것 같다는 막연한 생각때문 입니다.
Tensor 구조를 잠시 설명하자면 (16개의 기업, 72개월, 1개의 category, 즉 종가) 로 구성할 예정입니다.
16개의 서로 다른 기업이 각 batch로서 입력되고, 72개월 분의 time-step, 종가 로 구성되어 (16, 72, 1)의 입력 사이즈를 가지고 있습니다.
72개월인 이유는 2015년 부터 주가데이터를 사용하기 때문이며 2015년으로 선출한 이유는 딱히 없습니다.
또한 마지막 12개월은 얼마나 정확하게 예측을 하는지 활용하는 test data로서 활용할 예정입니다.
2015년부터 현재 2021년 12월까지는 총 84개월이며 이중 72개월을 학습데이터, 12개월을 테스트 데이터로 사용하는 것 입니다.
코드 설명
Library
!pip install -U finance-datareader
import FinanceDataReader as fdr

import random

import pandas as pd
import numpy as np
import matplotlib.pyplot as plt
plt.rcParams["font.family"] = 'nanummyeongjo'
plt.rcParams["figure.figsize"] = (14,4)
plt.rcParams['lines.linewidth'] = 2
plt.rcParams["axes.grid"] = True

from sklearn.preprocessing import StandardScaler

import torch
import torch.nn.functional as F
import torch.nn as nn

import warnings
warnings.filterwarnings(action='ignore')

device = torch.device("cuda:0" if torch.cuda.is_available() else "cpu")
print(device)
특별한 사항은 없습니다. Colab은 FinanceDataReader를 기본적으로 지원하지 않기 때문에 pip install명령어를 이용해 설치 한 후 사용해 주었습니다.
또한 마지막 줄에서 GPU 세팅을 해주었습니다.
DataSetup
df_krx = fdr.StockListing('KRX')
df_krx.head()

KRX, 즉 한국거래소에서 취급하는 주식 리스트를 가져 온 것 입니다.
잠시 데이터를 구경해 보았습니다.
df_krx[df_krx['Name'].str.contains('카카오')]
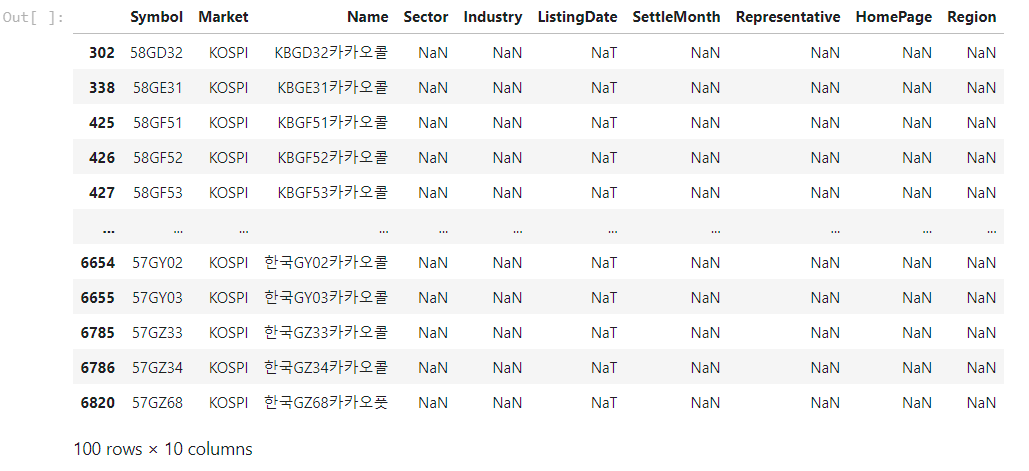
데이터를 구경하던 도중 주가가 존재 하지 않는 기업들을 발견하여 이름에 카카오를 포함한 기업리스트를 뽑아 보았습니다.
역시나 옵션거래의 흔적들이 떡하니 종목으로 존재하고 있었고 이들이 범인이었습니다.
df_krx.drop(df_krx[df_krx['Sector'].isnull()].index, inplace=True, axis=0)
df_krx.isnull().sum()
df_krx[df_krx['Name'].str.contains('카카오')]

Sector, 즉 어떤 업종인지가 비어있는 종목은 주가가 존재하지 않는 데이터라고 생각하고 지워주자 위와 같이 카카오라는 이름을 가진 기업 리스트가 나타나게 되었습니다.
kospi_short = fdr.DataReader('KS11','2015')
kospi_total = fdr.DataReader('KS11')
kospi_short['Close'].plot()

이는 2015년부터 코스피 종가데이터를 뽑아 본 것 입니다. 단순히 데이터를 확인해 보기 위해 실행하였습니다.
kospi_short.head()
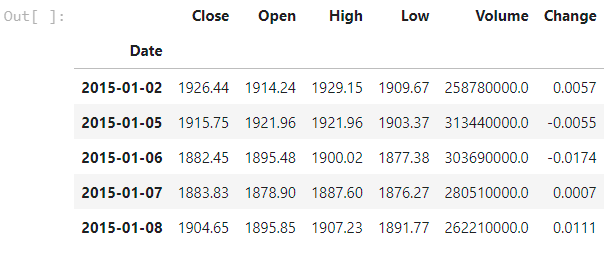
잠시 데이터를 살펴보면 위와 같이 일별로 구분된 데이터가 총 6개의 항목으로 존재하고 있습니다.
df = kospi_short.reset_index()
df.groupby([df['Date'].dt.year, df['Date'].dt.month]).mean()
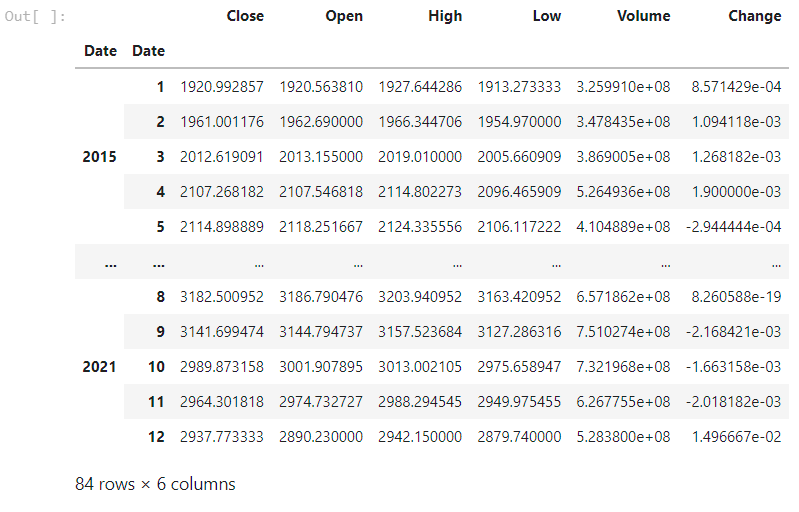
저는 월별 데이터를 사용할 예정이기 때문에 이와 같이 가공하여 월별 데이터로 만들어 주었습니다.
Hyperparameter setting
# hyper-parameter setting
num_sample = 16
epochs = 1000
learning_rate = 0.001
time_step = 84

hidden_dim = 512
output_dim = 12
input_dim = time_step - output_dim

# input_columns is number of input dataframe's columns
input_columns = 1
학습에 사용되는 Hyperparameter입니다.
num_sample은 batch사이즈로 이번 학습에 사용되는 기업이 총 16개라는 의미입니다.
time_step은 2015년 부터 2021년 12월인 현재까지 총 84개월이기 때문에 84로 두었습니다. 혹시 실행 년도가 바뀐다면 바꾸어 주어야 하는 부분입니다.
output_dim은 test 데이터로 사용할 12개월을 의미하며 input_dim은 총 time_step에서 output_dim을 뺀 dimension의 크기 입니다.
input_columns은 1개, 즉 종가만을 사용한다는 의미입니다.
Functions
# make a date chart as a month chart
# Data starts from 2015y, so sequence length will be different when you run this
def month_mean(symbol):
    df = fdr.DataReader(symbol, '2015').reset_index()
    df.drop(['Open', 'High', 'Low', 'Volume', 'Change'], axis=1, inplace=True)
    df = df.groupby([df['Date'].dt.year, df['Date'].dt.month]).mean()
    df.reset_index(drop=True, inplace=True)
    if len(df) < time_step:
        pad_len = time_step - len(df)
        pad = np.zeros((pad_len, 1))
        df = np.concatenate((pad, df), axis=0)
    return df

# make dateframe as input tensor and target tensor
def toTensor(df):
    tensor = torch.FloatTensor([df]).to(device)
    # (batch_size, sequence_length, input_size)
    # (num_sample, time step, num of columns)
    # (train_dataset), (valid_dataset) (test_dataset)
    # (16, 72, 1), (16, 72, 1) (16, 12, 1)
    return tensor[:,:-output_dim,:], tensor[:,1:-output_dim + 1,:], tensor[:,-output_dim:,:]
month_mean은 symbol, 즉 기업코드를 입력받고 월별로 정리된 종가를 numpy arrary로 return합니다.
월별로 정리하는 부분은 위 data부분에서 설명한 방식과 같으며 기업중에 꽤 자주 2015년 이후에 상장한 기업들이 time_step이 84가 되지 않았기 때문에 그 부분을 0으로 처리 한 후 앞에 붙여주었습니다.
toTensor는 numpy array를 입력받아 Tensor로 return 해줍니다.
또한 1개월 부터 72개월 (index로 하자면 0부터 71)까지를 train_dataset으로, 2개월부터 73개월 (index로 하자면 1부터 72까지)를 valid_dataset, 73개월부터 84개월(index로 하자면 72부터 84)를 test_dataset으로 분리해줍니다.
valid_dataset에 대해 이야기를 하자면 input으로 나온 결과가 그 다음 time_step이 되어야 함으로 한 time_step씩 밀린 형태가 된 것 입니다.
Model
# define a model
class LSTM(nn.Module):
    def __init__(self, input_columns, hidden_dim, num_layers):
        super(LSTM, self).__init__()
        self.lstm = nn.LSTM(input_columns, hidden_dim, num_layers=num_layers, batch_first=True)
        self.fc = nn.Linear(hidden_dim, 1)

    def forward(self, x):
        # input x has (16, 72, 5)
        x, _status = self.lstm(x)
        x = self.fc(x)
        return x

model = LSTM(input_columns, hidden_dim, 1).to(device)
LSTM을 정의 해 줍니다.
위에서 설명한 대로 LSTM 후에 Fully Connected Layer를 지나게 됩니다.
Criterion
import torch.optim as optim
criterion = nn.MSELoss()
optimizer = optim.Adam(model.parameters(), lr=learning_rate)
회귀 문제이기 때문에 MSELoss를 사용해 주었습니다.
Train and validation
def train_one_epoch(input_tensor,val_tensor, model):
    loss = 0.0
    optimizer.zero_grad()

    output = model(input_tensor).to(device)
    loss = criterion(output.view(-1), val_tensor.view(-1)).to(device)

    loss.backward()
    optimizer.step()

    return output, loss.item() / input_tensor.size(0)
한 epoch만큼 train하는 함수 입니다.
def validation(start_from):
    with torch.no_grad():
        output = torch.zeros((num_sample, output_dim, 1)).to(device)
        for i in range(output_dim):
            output[:,i:i+1,:] = model(start_from).to(device)
            start_from = output[:, i:i+1, :]
        return output
test dataset을 이용해 validation을 하는 부분입니다.
입력한 train data의 마지막 time_step의 예측값을 입력으로 받아 12개월 치의 예측치를 output으로 저장하여 return합니다.
def train_iter(model, epochs):
    import time
    import math

    def timeSince(since):
        now = time.time()
        s = now - since
        m = math.floor(s / 60)
        s -= m * 60
        return "%dm %ds" % (m, s)

    print_every = 100
    all_losses = []
    total_loss = 0

    start = time.time()
    random_symbol = df_krx['Symbol'].sample(n=num_sample)
    random_symbol.reset_index(drop=True, inplace=True)

    df = month_mean(random_symbol[0])
    ss = StandardScaler()
    df = ss.fit_transform(df)
    input_tensor, valid_tensor, target_tensor = toTensor(df)
    for i in range(1, num_sample):
        df = month_mean(random_symbol[i])
        df = normalization(df)
        input_tensor_temp, valid_tensor_temp, target_tensor_temp = toTensor(df)
        input_tensor = torch.cat((input_tensor, input_tensor_temp), 0)
        valid_tensor = torch.cat((valid_tensor, valid_tensor_temp), 0)
        target_tensor = torch.cat((target_tensor, target_tensor_temp), 0)

    for epoch in range(1, epochs+1):
        output_tensor, loss = train_one_epoch(input_tensor, valid_tensor, model)
        total_loss += loss

        if epoch % print_every == 0:
            print('%s (epoch : %d, %d%%) loss : %.4f' % (timeSince(start), epoch, epoch/epochs*100, total_loss / print_every))
            all_losses.append(total_loss/print_every)
            total_loss = 0

    plt.figure(figsize=(8, 6))
    plt.title('Loss')
    plt.plot(all_losses)

    val = validation(output_tensor[:, -1:, :])
    for n in range(num_sample):
        output = torch.cat((output_tensor[n, :, :], val[n, :, :]), 0)
        target = torch.cat((input_tensor[n, :, :],target_tensor[n, :, :]), 0)
        output = ss.inverse_transform(output.detach().to('cpu'))
        target = ss.inverse_transform(target.detach().to('cpu'))

        plt.figure(figsize=(10, 6))
        plt.axvline(x=72, c='r', linestyle='--')
        plt.plot(target, label='actual data')
        plt.plot(output, label='trained data')
        plt.legend()
        plt.show()
이번 프로젝트의 핵심 함수 입니다.
부분 부분으로 나누어서 설명하도록 하겠습니다.
    def timeSince(since):
        now = time.time()
        s = now - since
        m = math.floor(s / 60)
        s -= m * 60
        return "%dm %ds" % (m, s)
시간을 측정하기 위한 부분입니다. 딱히 없어도 무방합니다.
    start = time.time()
    random_symbol = df_krx['Symbol'].sample(n=num_sample)
    random_symbol.reset_index(drop=True, inplace=True)
시간 측정을 위한 timer를 켠 후 랜덤으로 16개의 기업코드를 뽑습니다.
    df = month_mean(random_symbol[0])
    ss = StandardScaler()
    df = ss.fit_transform(df)
    input_tensor, valid_tensor, target_tensor = toTensor(df)
    for i in range(1, num_sample):
        df = month_mean(random_symbol[i])
        df = normalization(df)
        input_tensor_temp, valid_tensor_temp, target_tensor_temp = toTensor(df)
        input_tensor = torch.cat((input_tensor, input_tensor_temp), 0)
        valid_tensor = torch.cat((valid_tensor, valid_tensor_temp), 0)
        target_tensor = torch.cat((target_tensor, target_tensor_temp), 0)
그렇게 산출한 기업 코드를 month_mean함수에 넣고 StandardScaler를 통해 normalization해 준 후 toTensor를 통해 Tensor로 만들어 줍니다.
normalization을 하는 이유는 기업마다 주가의 scale이 전부 다르기 때문에 학습에 지장이 생길 것 이라고 판단하였기 때문입니다.
이 후, for문을 통해 16개의 기업 전부 tensor에 batch로서 쌓아주는 형식 입니다.
    for epoch in range(1, epochs+1):
        output_tensor, loss = train_one_epoch(input_tensor, valid_tensor, model)
        total_loss += loss

        if epoch % print_every == 0:
            print('%s (epoch : %d, %d%%) loss : %.4f' % (timeSince(start), epoch, epoch/epochs*100, total_loss / print_every))
            all_losses.append(total_loss/print_every)
            total_loss = 0
학습이 진행되는 부분입니다. 설정된 epochs만큼 학습을 돌리며 print_every마다 loss를 측정하여 알려줍니다.
    plt.figure(figsize=(8, 6))
    plt.title('Loss')
    plt.plot(all_losses)
역대 로스를 그래프로 그려주게 됩니다.
    val = validation(output_tensor[:, -1:, :])
    for n in range(num_sample):
        output = torch.cat((output_tensor[n, :, :], val[n, :, :]), 0)
        target = torch.cat((input_tensor[n, :, :],target_tensor[n, :, :]), 0)
        output = ss.inverse_transform(output.detach().to('cpu'))
        target = ss.inverse_transform(target.detach().to('cpu'))
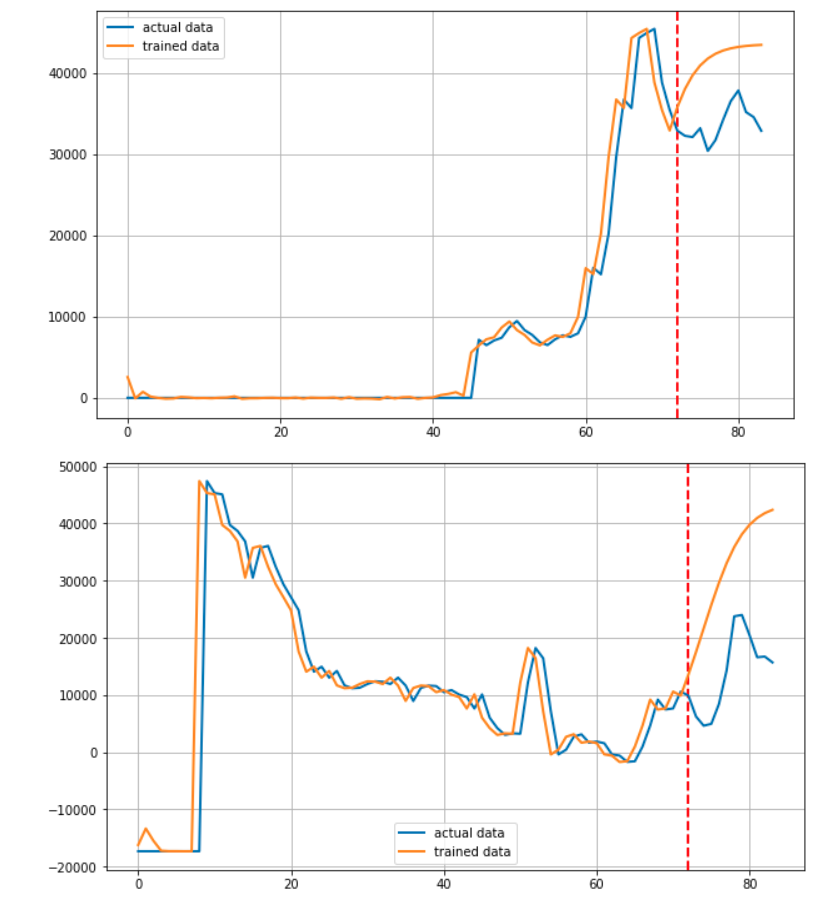
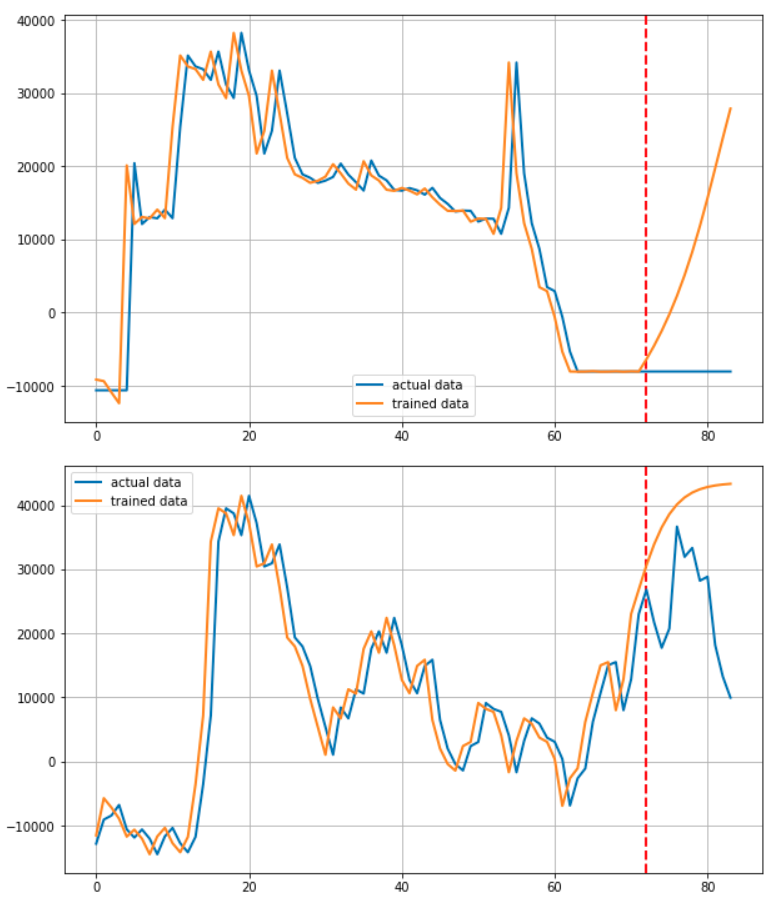
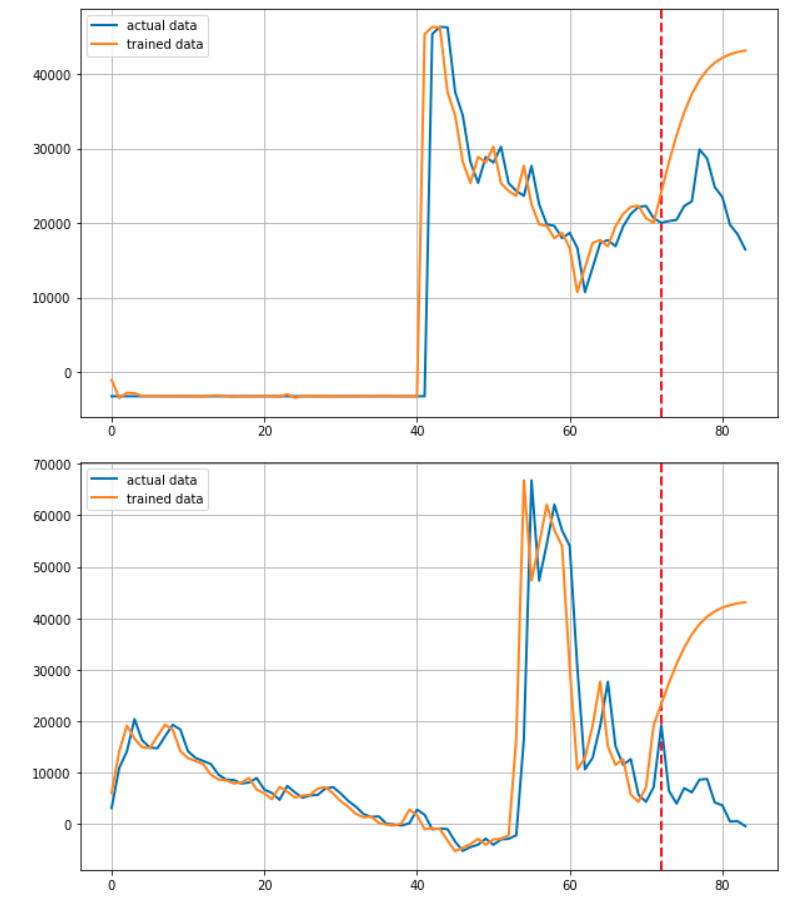
train을 통해 마지막 time_step에서 예측한 결과 값을 validation함수에 넣어주어 본격적인 마지막 12개월의 주가를 예측합니다.
이 후 for문을 통해 기업을 하나씩 선정하며 학습에 이용된 72개월 + 예측된 12개월을 연결하여 Predicted된 결과로
실제 학습에 사용된 72개월 + 마지막 12개월을 연결하여 Actual 데이터로서 저장합니다.
        plt.figure(figsize=(10, 6))
        plt.axvline(x=72, c='r', linestyle='--')
        plt.plot(target, label='actual data')
        plt.plot(output, label='trained data')
        plt.legend()
        plt.show()
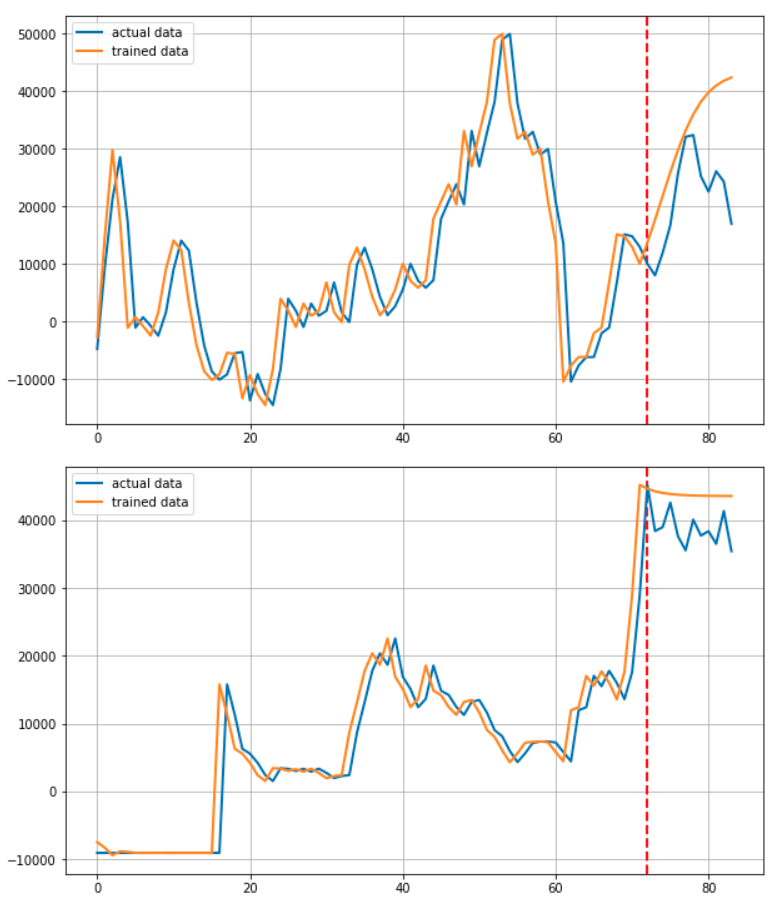
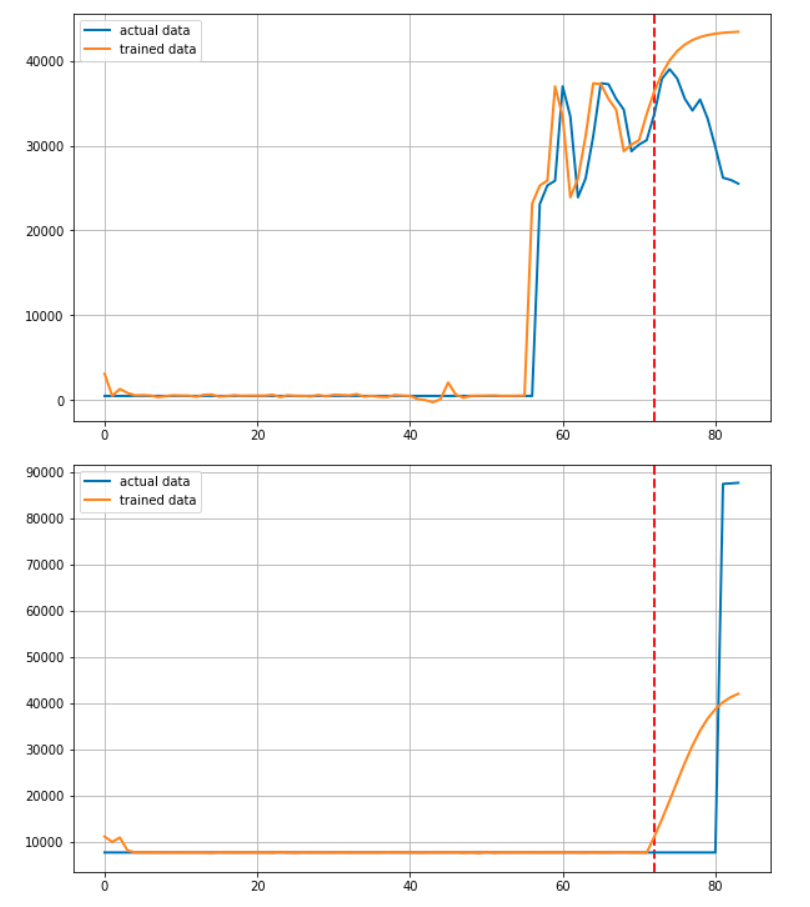
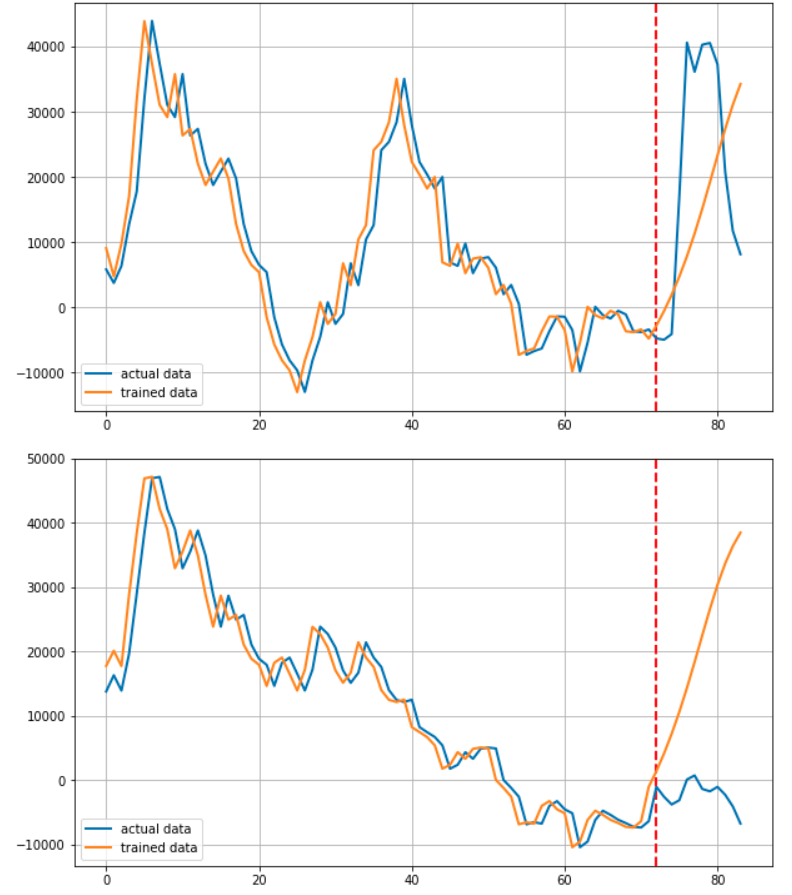
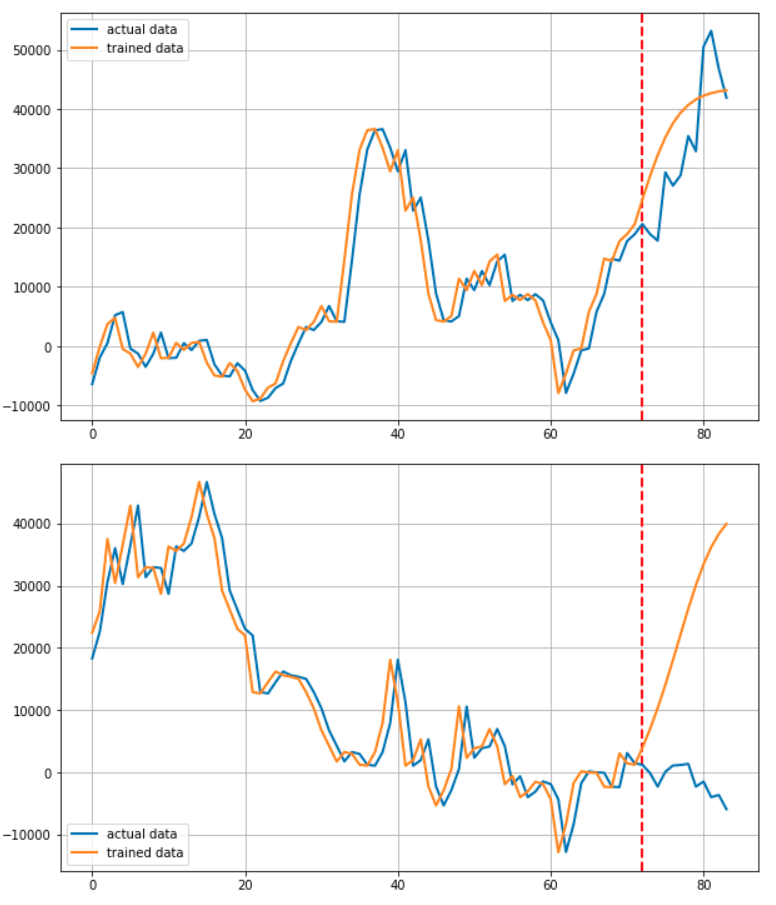
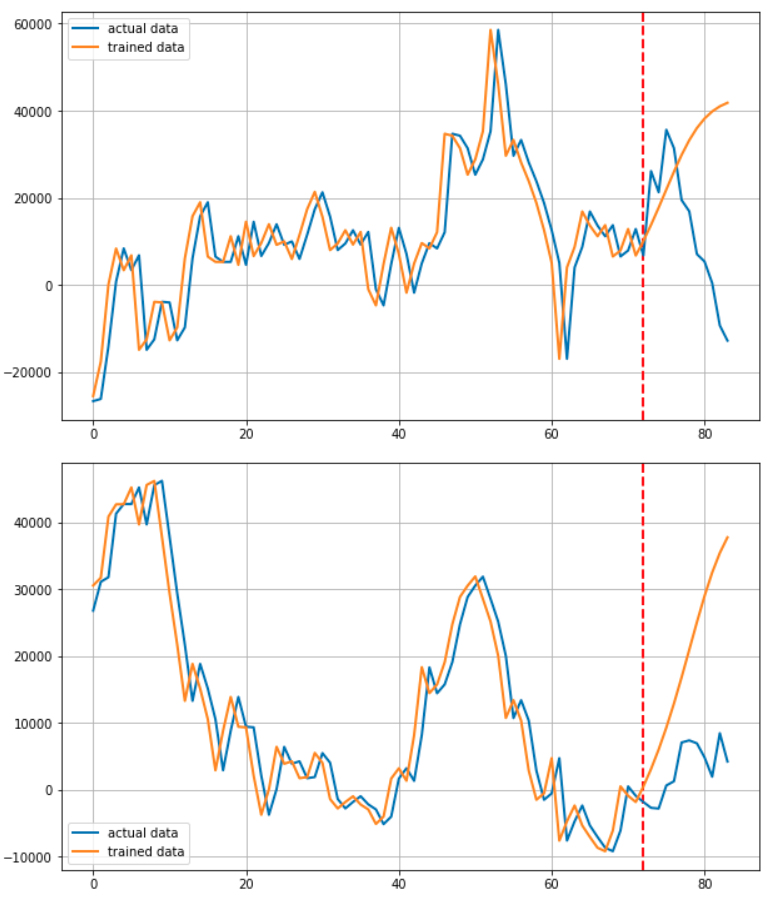
데이터를 그려주는 부분입니다. 빨간 점선을 그어 예측부분과 학습 부분을 알기 쉽게 구분할 수 있도록 하였습니다.
Main
train_iter(model, epochs)
학습을 돌려주는 부분입니다. 아래는 그 결과 입니다.
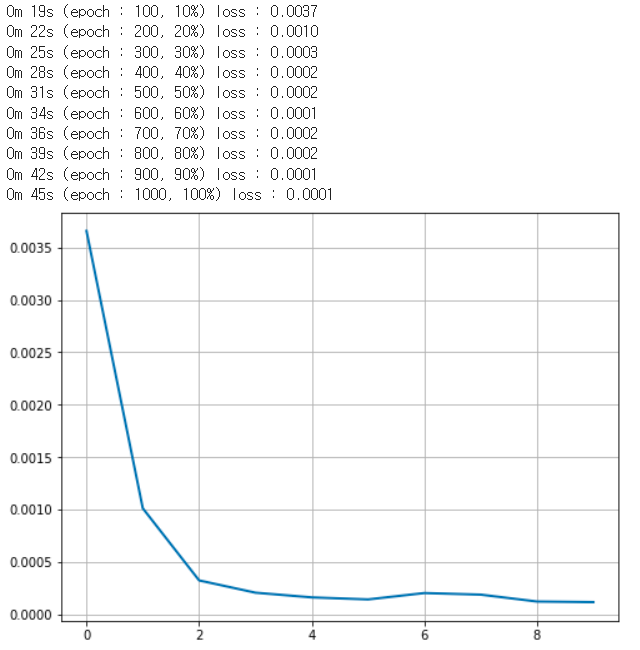
로스는 위와 같이 순조롭게 줄어들었습니다.
마치며
사실 이 프로젝트를 시작하고 얼마 후 RNN기반 모델로 주가를 예측하면 제대로 되지 않는다는 말을 들었습니다. 실제로 전혀 예측하지 못하고 있습니다.
하지만 자신의 손으로 직접 확인하고 싶었으며 이번 프로젝트를 진행하면서 PyTorch를 이용하여 코드를 구성하는 이해도 또한 무척 높아졌다고 생각합니다.
또한 time_step부분과 같은 부실한 점도 다음에는 더욱 개선하고자 합니다. 그리고 전체 구조도를 그리고 필요한 함수를 작성하는 능력을 길러야겠다고 느끼고 있습니다.
이번 프로젝트는 자신의 손으로 처음부터 끝까지 진행하였으며 그동안 학습했던 내용을 활용 할 수 있어서 더욱 애착깊은 프로젝트 였다고 생각합니다.
