EDA netflix data
1. 개요
- 모든 코드는 깃헙에 공개되어 있습니다.
https://github.com/nanoteyep/ToyProject/tree/main/EDA/Netflix
- 이번 포스팅은 지금까지 배운 내용을 바탕으로 EDA, 시각화 연습을 같이 해보도록 하겠습니다.
- 이번에 사용할 데이터는 netflix data라는 데이터 이며
https://www.kaggle.com/shivamb/netflix-shows 혹은 제 깃헙에서 다운로드 받을 수 있습니다.
2. 라이브러리
import numpy as np
import pandas as pd
import matplotlib.pyplot as plt
import seaborn as sns

sns.set_theme(style='whitegrid')
3. 데이터 파악
df = pd.read_csv("./netflix_titles.csv")
df.head()

df.info()

df.isnull().sum()
- 먼저 head()함수를 통해 앞에서 5개만 살펴보고 어떤 구조인지 살펴봅니다
- info()함수를 통해 좀 더 상세한 정보를 알 수 있습니다.
-
마지막으로 null값의 정보를 확인해 보았습니다.
- 이번 데이터 분석의 목표는 시각화 이기때문에 null값이 큰 의미를 가지지는 않는다고 생각하여 null값에 대한 처리는 해주지 않았습니다.
4. 시각화
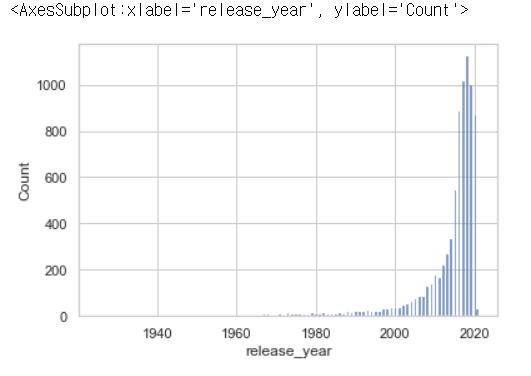
sns.histplot(data=df,x='release_year')

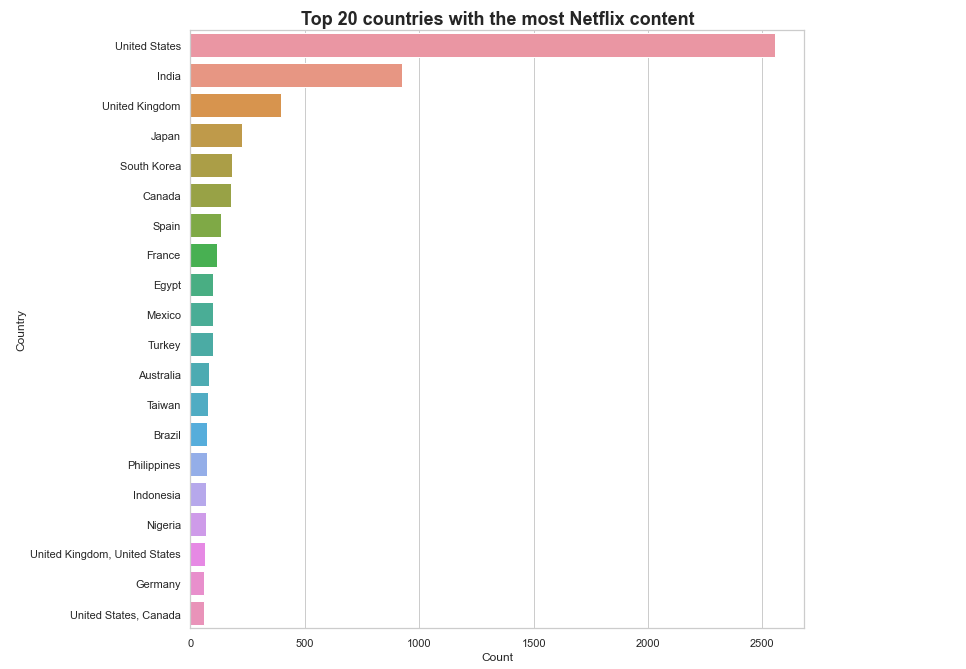
# Too many country, so select top 20 country
data_1 = df['country'].value_counts().reset_index().head(20)
data_1.columns = ['Country' , 'Count']

plt.figure(figsize = (11,11))
sns.barplot(x = 'Count' , y = 'Country' , data = data_1)
plt.title('Top 20 countries with the most Netflix content' , fontdict={ 'fontweight' : 'bold', 'fontsize' : 18 })
plt.show()

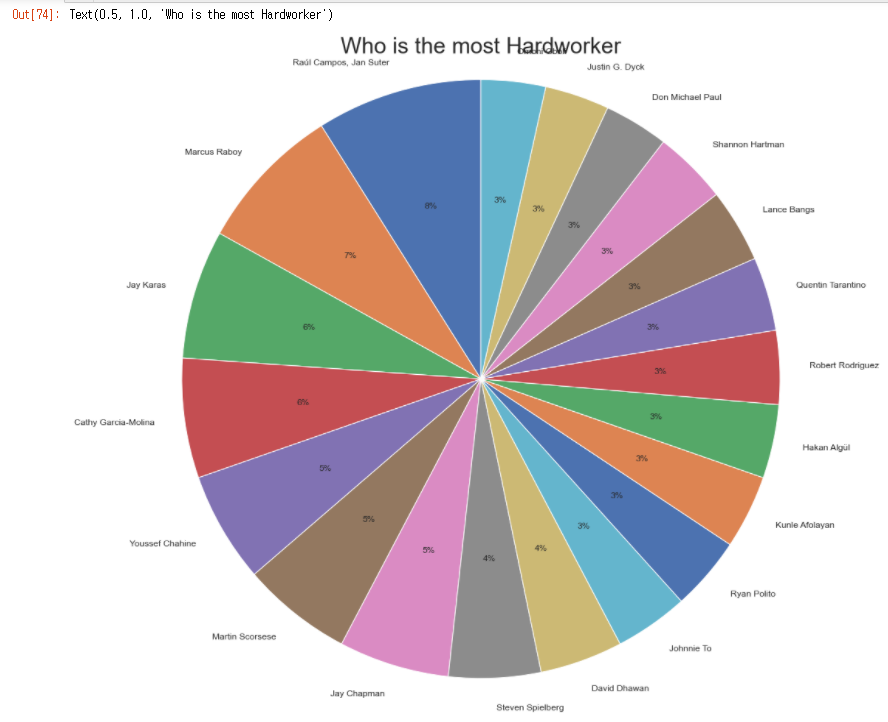
direc_data = df['director'].value_counts().reset_index().head(20)
direc_data.columns = ['director', 'counts']

# plt.figure(figsize=(11,11))
# plt.pie(data=direc_data, x='counts', y='director')
# plt.title("Most Hardworking Director TOP 20", fontdict={ 'fontweight' : 'bold', 'fontsize' : 18 })

plt.figure(figsize=(16, 16))
plt.pie(direc_data.counts,
       labels=direc_data.director,
       autopct='%d%%',
       startangle=90,
       textprops={'fontsize':12})
plt.axis('equal')
plt.title("Who is the most Hardworker", fontsize=30)

마치며
이번 포스팅은 지금까지 배운 데이터 분석능력을 통해 실제 데이터를 시각화 해보는 연습을 해보았습니다. 앞으로 가능한 이런 데이터 분석 실습을 최대한 많이 해보려고 합니다.
